by Matt Florell
This is an analysis of the City of St. Petersburg's red
light camera program and the second year report that was released by the City.
There are many references to the City's report in this analysis, and it is
located here for you to download and look at as you read through the analysis,
http://www.stpetepolls.org/rlc/StPete_20140116_RedLightCamera_Update_report_year2.pdf
http://www.stpetepolls.org/rlc/StPete_20140116_RedLightCamera_Update_report_year2.pdf

If you were just to read the summary of the second year
red light camera report, you might think that adding red light cameras was a
panacea to traffic safety. The results of which were a massive reduction in
crashes, and catching tens of thousands of dangerous drivers traveling on our
City's roads. What you would start to notice if you continued to read past the
first few pages and into the rest of the report, is that this is a much more
complex topic than the summary leads on. It is true that crashes have gone down
at red light camera intersections, but just barely(-2.6%), and crashes are
still higher than the year before the cameras were installed. Also, the
comparison intersections without cameras have had a much greater reduction in
crashes(-9.1%) than the camera intersections themselves did. If you look at the
crash rate change, the difference is even greater, with the camera intersection
crash rate drop at -2.6% and the non-camera intersection crash rate over ten
times greater at -28.9%. The intersections without cameras are getting much
safer, while the camera intersections have barely changed.
The rosy declarations of massive drops in "red
light related" crashes mentioned in the summary, in reality, are mostly
offset by the near-doubling of rear end crashes and the large increase in angle
crashes at the red light camera intersections. It's almost like squeezing a
balloon on one side only to see the other side bulge outward. The crash rate is
not significantly going down, it's just changing the classification of crashes
from "red light related" to other types of crashes. One reason for
this is that when you have cameras monitoring an intersection, you can use them
to investigate what really happened in a crash. After reading through hundreds
of police crash reports from the second year of the program, I did notice
several instances where a crash that a witness would claim was a red light
running crash, was in fact a failure to yield crash. What surprised me
most
about these crash reports was just how few of the many hit-and-run crash
investigations were really helped by having the red light camera video to
review. The problem is, while the video can clearly show which vehicle is at
fault, it can't identify the license plate of a car unless it actually ran a
red light and a high-resolution still photo was taken, that happens when you
see the bright flash. The vast majority of crashes at red light camera
intersections did not involve a car actually running a red light. In several
cases where there was a hit-and-run crash, the police only have the color and
type of vehicle to go on from the camera video, and most of those go on to
remain unsolved.
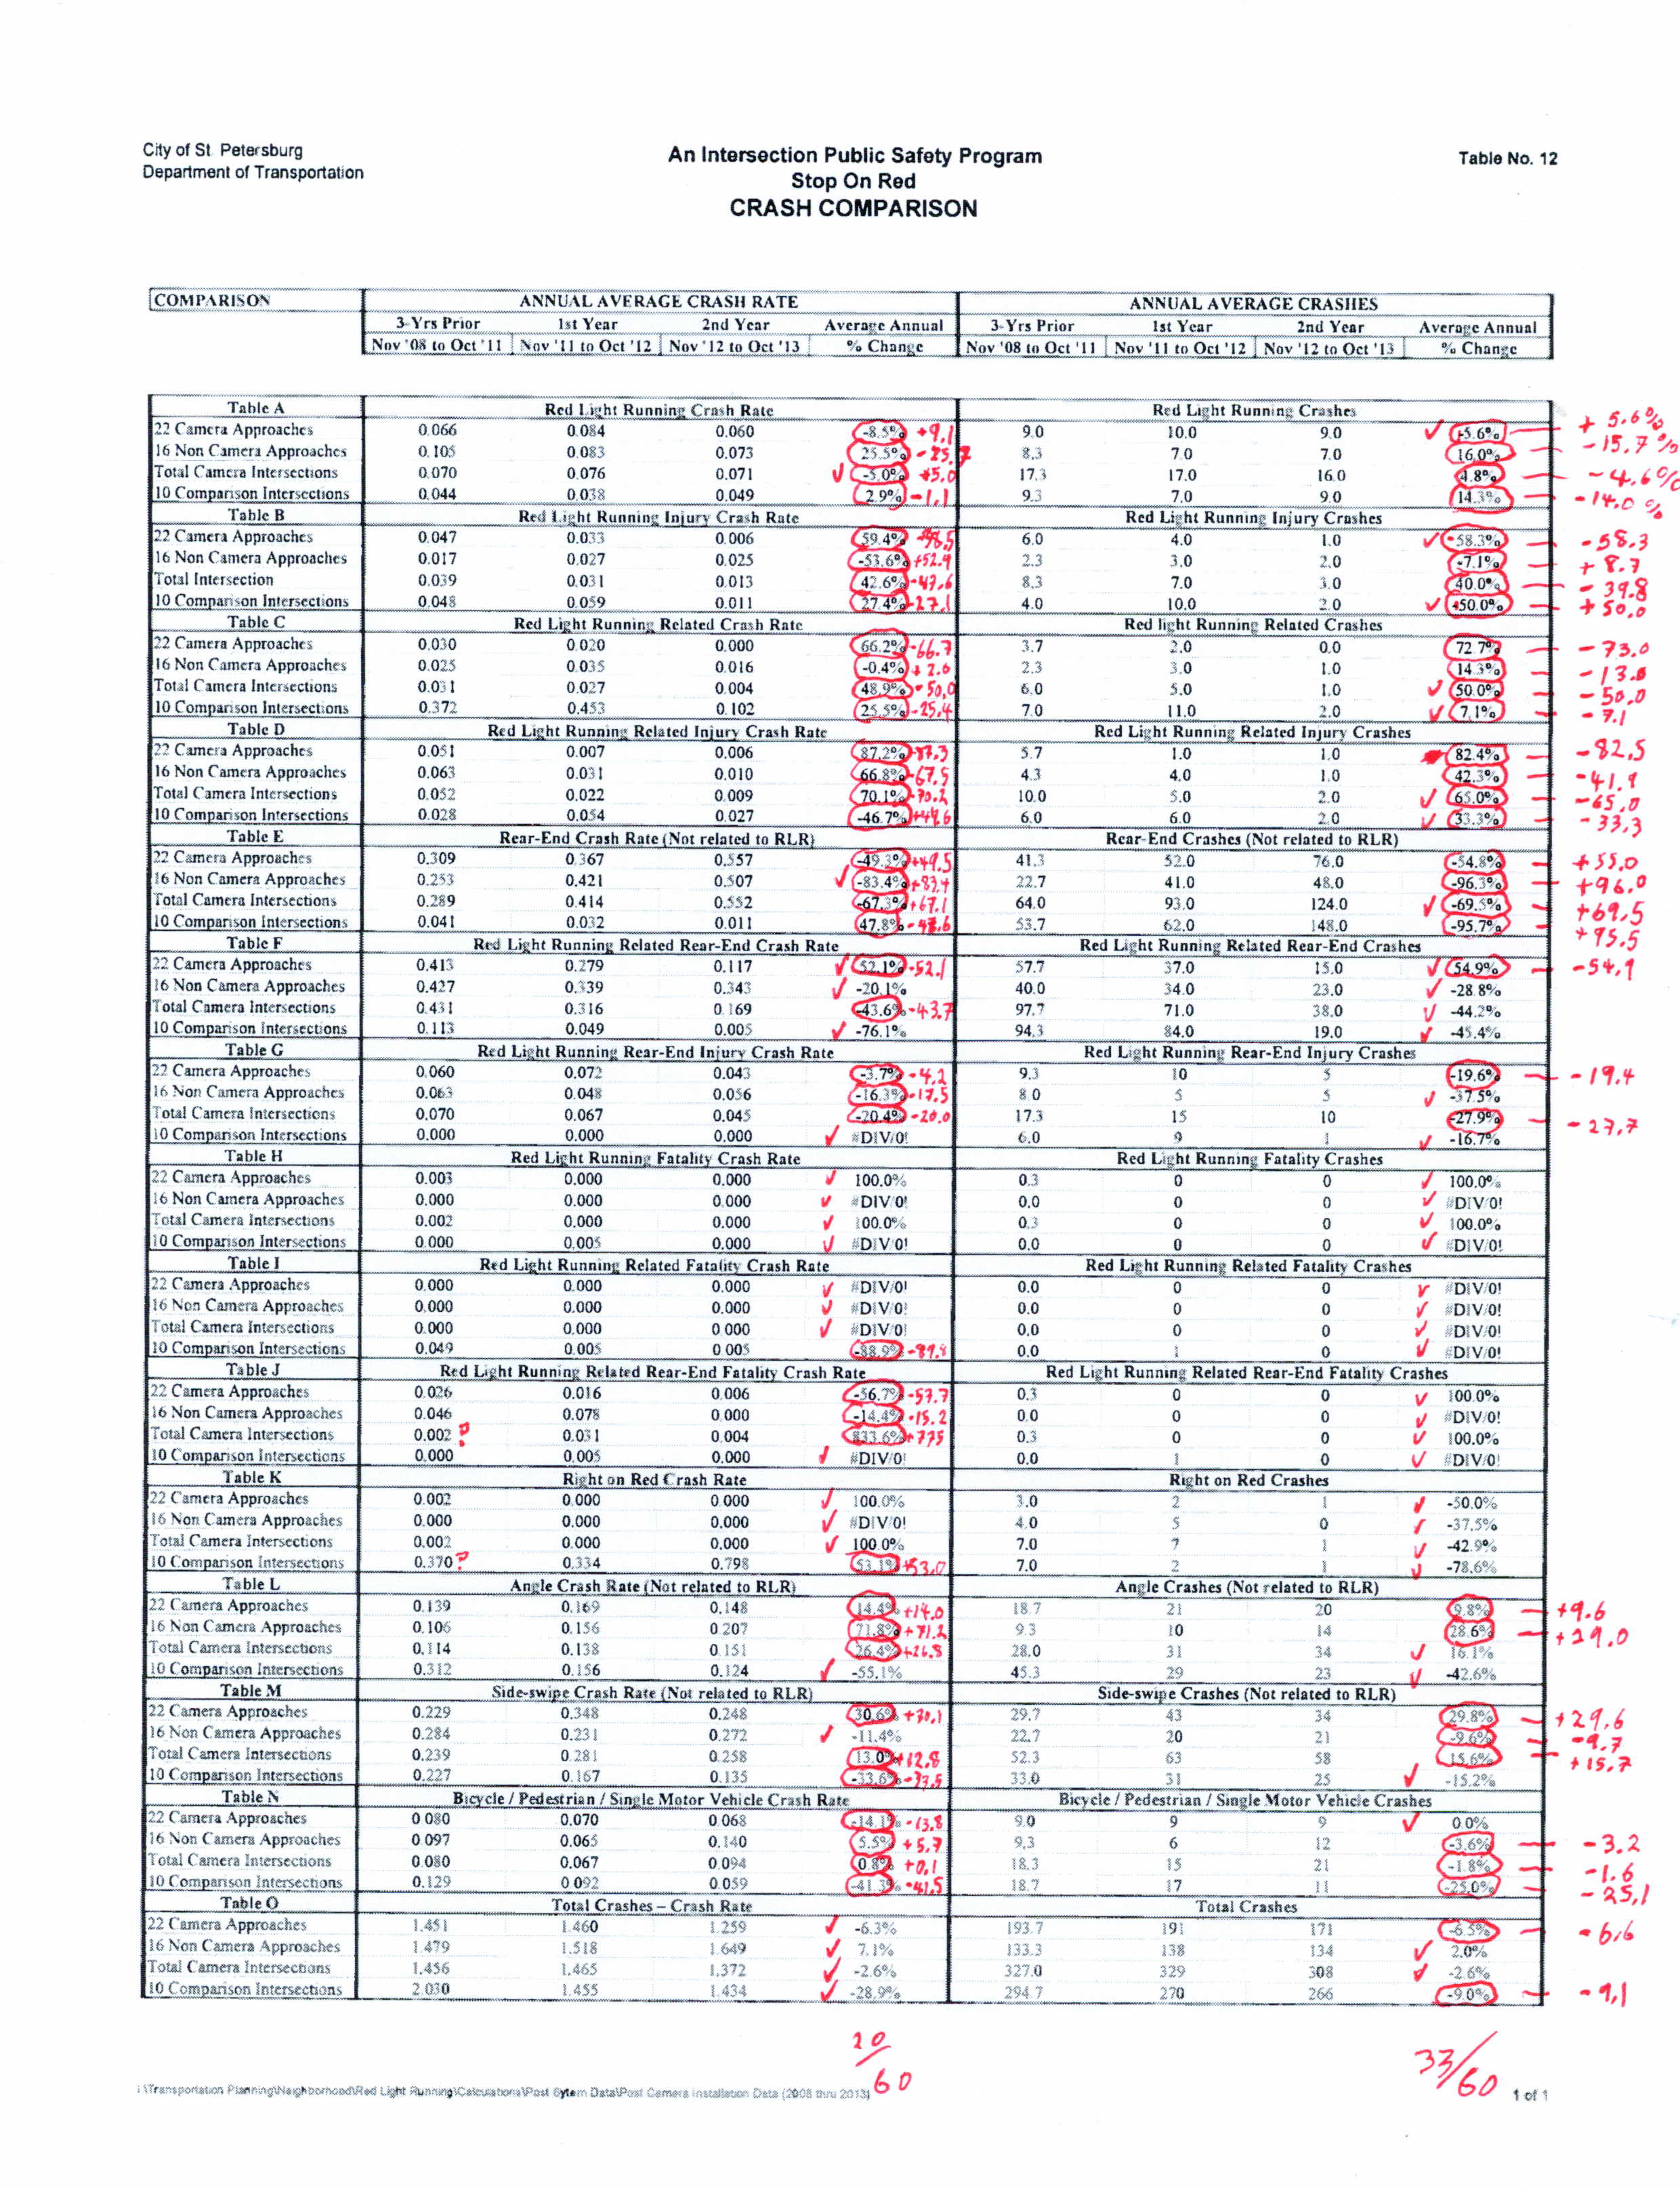
The
most revealing information in this report is located on page 63. On this page
is an error-ridden spreadsheet that documents the changes in the crash rates
and number of crashes at the 10 red light camera intersections and 10
comparison non-camera intersections. It is very important because all of the
crash numbers mentioned throughout the report are based upon this one page. I
say "error-ridden" because there are many math errors ranging from
incorrect percentage calculations to improper use of negative/positive
percentage numbers. In several places a decrease in crashes is shown with a
positive percentage, when further down a similar change is negative, and the
opposite is true of several crash increase percentages too. As for the
percentage calculation errors, to properly calculate a percentage change, you
have to assume the first number, or the "before" number is the
starting point for 100%(http://www.percent-change.com).
That isn't what is done in most of the calculations on this page. For example,
the decrease in red light running crashes at red light camera intersections
from 17.3 to 16.5 is shown as "4.8%" when it really should be
"-4.6%". Only 53 of the 120 calculations on this page are done
correctly, and most of those involve 0 as one of the numbers.
This spreadsheet on page 63 also shows you at the bottom that crashes at red light camera intersections went down only -2.6% while the comparison non-camera intersections went down much more, -9.0%(which would really be -9.1% if proper math had been used). I am using the full intersection statistics because that's what the state of Florida uses when it requests reporting information and when it releases reports. It is also how St. Petersburg was releasing reports before the cameras were installed. It is not explained why the City focuses only on camera approaches comparing to the non-camera full intersections. That is a non-similar comparison, a bit like comparing apples and oranges, and is not consistent with older reports from the city or what the state standard is. Even looking only at those segregated approach statistics, the crash decrease is still only -6.5%(which should be -6.6%, again, if proper math was used).
This spreadsheet on page 63 also shows you at the bottom that crashes at red light camera intersections went down only -2.6% while the comparison non-camera intersections went down much more, -9.0%(which would really be -9.1% if proper math had been used). I am using the full intersection statistics because that's what the state of Florida uses when it requests reporting information and when it releases reports. It is also how St. Petersburg was releasing reports before the cameras were installed. It is not explained why the City focuses only on camera approaches comparing to the non-camera full intersections. That is a non-similar comparison, a bit like comparing apples and oranges, and is not consistent with older reports from the city or what the state standard is. Even looking only at those segregated approach statistics, the crash decrease is still only -6.5%(which should be -6.6%, again, if proper math was used).
The next discrepancy that I noticed after I requested
the police crash reports for the second year at all of the camera intersections
and the non-camera comparison intersections is that the number of reports I was
given don't match up to the second year total crashes in this report, no matter
what date ranges I used to try to match them up. Then I looked at last year's
red light camera report and I noticed that not even all of those numbers, which
are supposed to be for the same time periods, match up to this second year
report. How are we supposed to rely on the information in this report if these
numbers that are supposed to be the same don't match?
Another issue with this report is how these crashes are categorized. With the method they are using, a crash that involves someone turning right on red and hitting a pedestrian can only go in one of those two categories. So which one was chosen, and why aren't these crashes flagged instead of categorized so you can see the whole picture of what all of the factors in these crashes are? The angle crashes category is claimed to only be "non red light related", but there is no "red light related angle crash" category, so how can those two ever be compared? This categorization technique is unique to St. Petersburg, and is not used in any of the academic research on this subject, because it gives a very incomplete picture of the data. That is also true of their choice to ignore other major crash factors like impaired driving.
As for the re-offenders statistics that are shown in this report, they are separated by first year and second year. This is a bit counter intuitive and misleading, because it doesn't show you how many re-offenders there were for the whole 2 year program. Since I have the full citation data I can tell you that number is 10.2% (5645 multiple citation vehicles out of 55113 total unique citation vehicles). The figure that is shown several times in the report of 94% non-reoffending vehicles is misleading.
Among the re-offenders, there have been 245 vehicles that have received 4 of more citations. If these drivers had been caught by police officers instead of the cameras they would have had their licenses suspended. But with camera citations, it doesn't matter how many they get, their driving record remains untouched. We have heard in Council meetings and written in this report a comparison between police enforcement and camera enforcement, but the two are not even close to equal, either in the penalties for violations or the results of enforcement.
Looking at the St. Petersburg resident citation statistics, we have been told that this percentage comes from using zip codes of addresses within the city. The problem with that is over 10% of the residents of the City of St. Petersburg live in zip codes that are not completely within the city limits. Looking at the zip code list used on page 32, they are missing four zip codes,(33707, 33709, 33714, 33715). Are those people included in these totals? By my calculations they are not, and the number of citations issued to city residents is actually several percentage points higher than stated in the City's report.
The number of violations issued in the first year of the program(October 29, 2011 to October 28, 2012) is also wrong in the report, it should be 35,961 and the second year number is off as well, it should be 25,972. The reason for the reduction in citations from the first to second year is only attributed to changes in driver behavior, but there are several other causes that have had an effect on reduced citations. For several months in the second year, the citations issued to rental car companies and other affidavit citations stopped completely, that accounted for over 10% of citations at the time. Also, the number of citations showing a short yellow time declined from 4% in the first year to almost nothing by the end of the second year, that was mostly as a result of changes in the police review process. The last two months of the second year also saw a very steep increase in the overall rejection rate of police reviewed citations(shown on page 65). All of these second year changes resulted in a significant impact on the reduction in citations.
One piece of information completely missing in this
report compared to last year's report is the amount of money paid to the City's
vendor, ATS. In fact, there is no detailed accounting of any kind as to exactly
where all of the profits from this program went once they ended up in the
City's general fund. There is also no detailed accounting of the
program-associated costs. This detailed information has been requested by more
than one City Council member over the last year, but it never seems to be
delivered or released.
Also missing from this year's summary and analysis of the report is any mention of the "crash rate" change. Last year's report mentioned this information prominently in several places, but this year's report only shows it on page 63 in tiny print. One reason why might be that, as mentioned at the top of my analysis, the crash rate drop was over 10 times greater at the non-camera intersections.
Also missing from this year's summary and analysis of the report is any mention of the "crash rate" change. Last year's report mentioned this information prominently in several places, but this year's report only shows it on page 63 in tiny print. One reason why might be that, as mentioned at the top of my analysis, the crash rate drop was over 10 times greater at the non-camera intersections.
It is safe to say that if this report were subjected to
peer review, it would be ripped apart. The reporting of incorrect numbers, lack
of attention to detail, non-standard reporting techniques and a clear bias in
presenting selected information is, unfortunately, consistent with how the red
light camera program has been managed from the beginning. As an example of
that, we have heard several times over the last three years that city staff had
"double and triple checked the yellow light timing" at red light
camera intersections. But if they had really thoroughly checked them just one
time in those three years, they would have noticed that they were ignoring a
very important part of the ITE formula, the slope of the intersection approach.
I brought that critical oversight into the light last month. When that
happened, staff did fix the problem, but they continued to be evasive,
inconsistent and misleading in their explanation of why that happened in the
first place. Their focus has been on keeping the red light camera program going
and continuing to sell it to City Council, not in putting forward neutral and
unbiased information related to the red light camera program.
On February 10th, at the state level, OPPAGA released
their report on red light cameras in Florida, and came to the conclusion that
most cities haven't been using red light cameras as a method of last resort and
that they are using them to generate money. St. Petersburg was listed as a city
in the top 10 in terms of how much profit was made on their cameras. In red
light camera locations, overall crashes have gone up, angle crashes have gone
up, rear-end crashes have gone up, but sideswipes, head-on and fatal crashes
have gone down. The evidence seems to show that crashes, especially the most
dangerous angle crashes, are not being prevented by the presence of the
hundreds of red light cameras in Florida.
http://www.stpetepolls.org/rlc/OPPAGA_Florida_Red_Light_Camera_Final02-07-14.pdf
http://www.stpetepolls.org/rlc/OPPAGA_Florida_Red_Light_Camera_Final02-07-14.pdf
So, now that you've read my analysis, what should the
city do with their red light camera program? I think it should be ended. Most
people in the City want them gone,
http://stpetepolls.org/surveys/stpete_2013_november.html, and it's not just my polling that shows that,
http://www.tampabay.com/news/localgovernment/tampa-bay-times-bay-news-9-wusf-public-media-poll/2149146
http://stpetepolls.org/surveys/stpete_2013_november.html, and it's not just my polling that shows that,
http://www.tampabay.com/news/localgovernment/tampa-bay-times-bay-news-9-wusf-public-media-poll/2149146
St. Petersburg would not be the first Florida city to remove their installed
red light camera systems either. Eight other Florida municipalities have
abandoned their camera ticketing programs in the last 3 years. St. Petersburg's
program has also alienated hundreds of people who have unjustly received short
yellow signal tickets through no fault of their own, and created an expectation
of perfection for drivers. That creates an especially frustrating
double-standard, since perfection is something that our own City traffic
signals have had proven and documented problems attaining for themselves, yet
the City faces no financial penalties for their mistakes.
I do understand that there might not be enough votes in City Council to kill the program, and if changes at the state level don't kill the program for us later this year, the City should consider adopting a more lenient policy toward using these cameras. Palm Beach County uses a half-second grace period into the red where they won't issue red light camera citations, and a non-ticketing policy for right turn on red violations. City Staff members here in St. Pete have claimed that doing this would only lead to more red light running, although evidence from Palm Beach County suggests that would not be the case. Palm Beach County has had cameras for 3 years, and the whole time they have publicly had a grace period of a half second into the red. In spite of this, the number of citations issued has steadily gone down slowly over the life of their camera program, the opposite of what staff believes would happen,
http://www.pbcgov.com/pubInf/Agenda/20140204/5f1.pdf
As for eliminating right-turn-on-red enforcement, 41% of Florida red light camera cities do not issue right turn citations, so it is not an uncommon practice. Also, the crash statistics show that right turn enforcement has no safety benefit whatsoever.
There is also an issue with consistency in enforcement of right turn citations. The city uses a 12mph standard for careful and prudent, but the speed sensors are proven to be inaccurate over 12% of the time, and the sensors are as far as 20 feet away from the stop bar, so they are not measuring the speed of the vehicle as it goes past the stop line.http://www.wtsp.com/news/topstories/article/326383/250/Floridas-right-turn-trap-exposed
Also, in the City's red light camera hearings, right turn citations issued at up to 15 mph have been thrown out by the hearing officer who ruled them careful and prudent. Either raising the speed standard significantly or eliminating right turn enforcement entirely would remove this accuracy and consistency problem completely.
Get The Facts on Red Light Cameras(RLC) > Pinellas RLCs > St. Petersburg RLCs >
Please feel free to copy and redistribute this analysis in any way you see fit
End report
Here is the link to Matt Florell's report: http://www.stpetecameras.org/home/other-pinellas-rlcs/st-petersburg/st-petersburg-red-light-cameras-second-year-analysis
e-mail Doc at: dr.webb@verizon.net, or send me a Facebook (Gene
Webb)Friend request. See More of Doc at Bay
Post Internet and St.Pete Patch, Gulfport Patch, Clearwater Patch, Palm Harbor Patch, Largo Patch.
Disclosures: Contributor to No Tax for Tracks
Disclosures: Contributor to No Tax for Tracks
No comments:
Post a Comment
Note: Only a member of this blog may post a comment.